Week 22: Warsh's Inheritance: A Stagflation Trap, a 5% Thirty-Year, and an Oil Market Hostage to Tehran, Markets Closed Monday for Memorial Day
Data Source: CME Group, EIA, CFTC COT (May 12, 2026 report), Prices as of May 22, 2026, 11:45 CST.
- Treasury yields spiked to multi-year highs this week (10yr: 4.70%, 30yr: 5.12%) as FOMC minutes confirmed rate hike readiness under new Chair Warsh — ZN remains in a structural bear move with no floor in sight.
- Markets now price a 42% probability of a Fed hike by December 9, 2026, driving SR3Z26 to new contract lows; the 'rate-cuts incoming' narrative from Q4 2025 is decisively unwinding.
- WTI crude (CLN26) posted the week's most violent session: −5.66% on May 20 following Trump's 'final stages' Iran deal comment, then recovered +3% on Thursday as deal skepticism returned — the Iran binary remains unresolved.
- RBOB gasoline outperformed crude as the crack spread widened to ~$28–30/bbl — Memorial Day driving season demand is providing a structural bid that absorbed the Iran-driven crude sell-off.
- Soybeans (ZSN26) sidelined: corn and soy planting is running 10 days ahead of 5-year average pace, Brazil's record 186 MMT crop weighs on fundamentals. Watch for Corn Belt drought escalation above 40% of production area.
Week in review: Macro context
The week of May 18–22 delivered two reinforcing narratives that dominated every major futures market: a Treasury complex in structural repricing as Kevin Warsh's debut as Fed Chair collided with sticky inflation and hawkish FOMC minutes; and an energy complex whipsawed by a potential US-Iran agreement that arrived, evaporated, and arrived again. The common thread binding both stories is the same: inflation is not defeated, and financial markets are being forced to price that reality into every curve, every contract, and every duration bucket.
On the rates side, the 10-year Treasury yield briefly touched 4.70% on Tuesday — a 16-month high — before pulling back to 4.60% mid-week as the Iran deal momentarily soothed energy price risk. The 30-year yield reached 5.12%, its highest since 2007, as the combination of Moody's Aa1 downgrade (effective mid-2025), record Treasury issuance ($691 billion sold in a single week of auctions), and now-official rate-hike odds applied relentless pressure — the December 2026 SOFR embedding a 42% probability of a 25bp hike by December 9, 2026. FOMC minutes released Wednesday made explicit what Warsh had only implied: rate increases may be warranted if inflation stays elevated.
In energy markets, President Trump's comment that the US is in the 'final stages' of an Iran deal sent July WTI (CLN26) crashing 5.66% on Wednesday, May 20, from $104–$105 to an intraday low of $96.82 — one of the sharpest single-session moves of the year. Markets don't fully believe the deal: Iranian state media subsequently denied that there was a final agreement.
The macro regime is clear: inflation is the master narrative, and Warsh's data-dependent posture creates maximum optionality for the bond market to continue selling. Every upcoming inflation print, Fed speaker appearance, and geopolitical development in the Strait of Hormuz is a binary catalyst for rates and energy simultaneously. Tactical traders should size accordingly.
The ZS soybean market, meanwhile, offered no entry point: corn and soy planting is 10 days ahead of the 5-year average pace, Brazil's record crop weighs on global supply, and China's tariff structure continues to favor Brazilian imports. No breakout catalyst; sidelined for now.
Market snapshot
Data basis: CME Group, Prices as of May 22, 2026 11:45 CST.
| Market | Contract | Last | Wk Chg | Wk % | Signal |
| 10yr T-Note | ZNM26 | 109'12 | −0'24 | −0.75% | Bear trend — yields at 4.60%; no floor |
| 3M SOFR Dec | SR3Z26 | 95.62 | −0.12 | −0.13% | Hike repricing — 42% Dec hike priced |
| WTI Crude Oil | CLN26 | $101.20 | −$3.80 | −3.60% | Volatile flush + bounce — Iran binary unresolved |
| RBOB Gasoline | RBN26 | $3.435 | −$0.09 | −2.50% | Compression — all-time high reversal; China demand vs tariff bid |
| Soybeans | ZSN26 | $11.74 | −$0.18 | −1.50% | SIDELINED — planting ahead of pace; no catalyst |
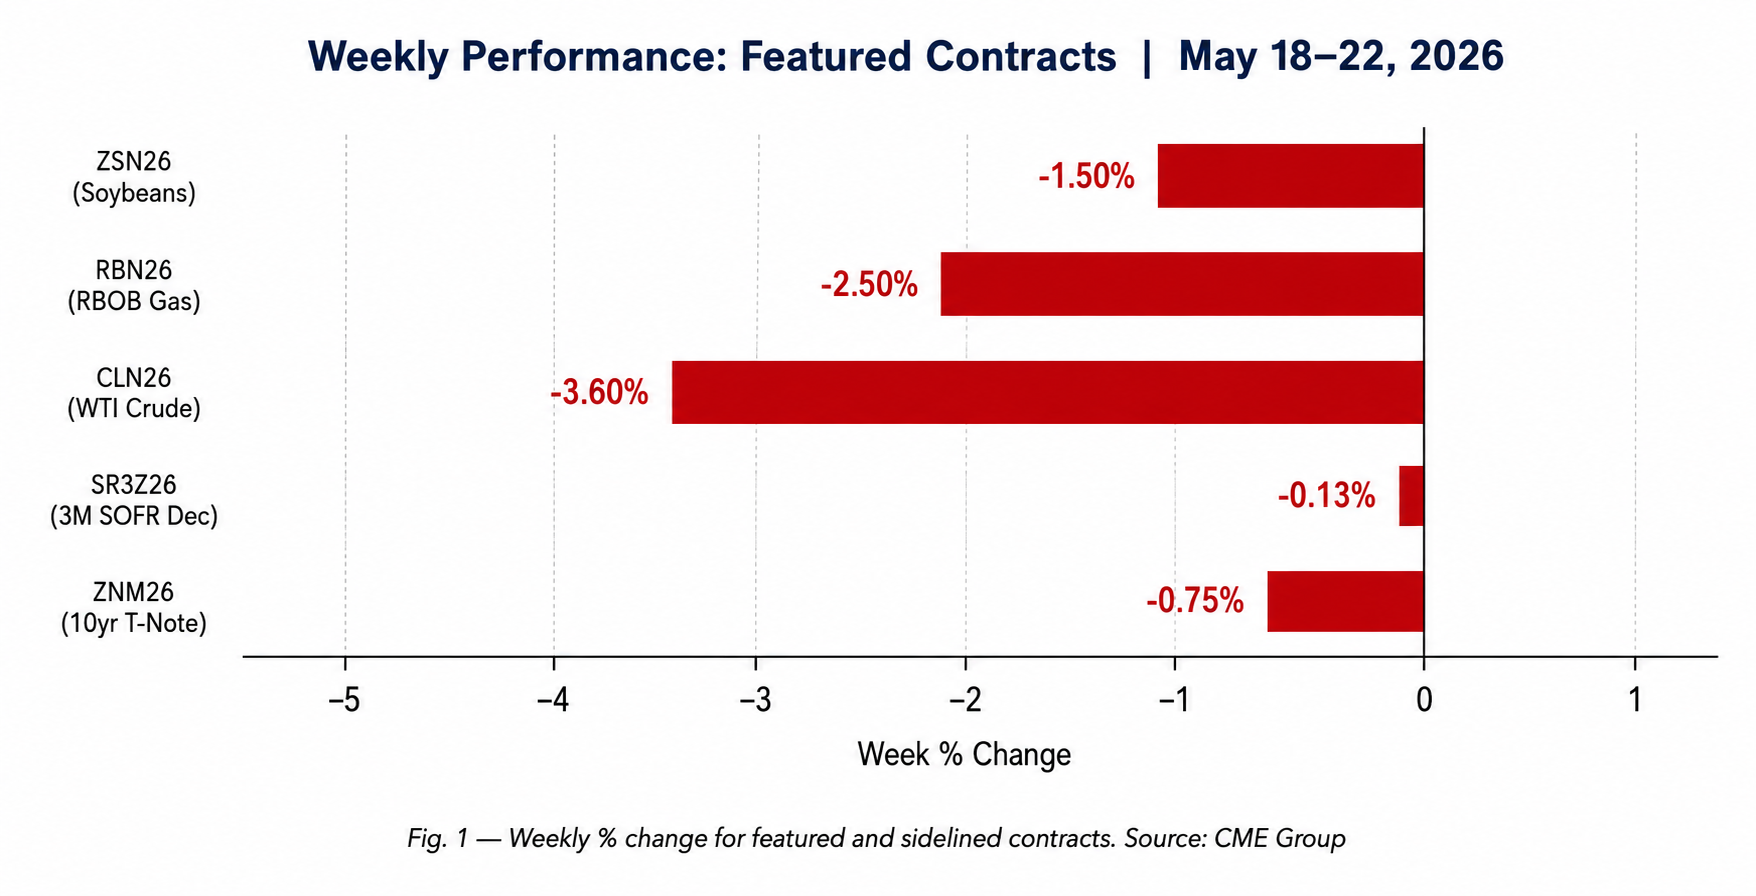
Fig. 1 — Weekly % change for featured and sidelined contracts. Source: CME Group
10-year Treasury Note (ZN) — Warsh's bear market in bonds
Treasury futures (ZNM26) delivered the week's defining fundamental story — a structural repricing of US sovereign risk that tactical short sellers can ride with clear conviction and defined risk, provided they can navigate the Iran geopolitical binary that also drives yields via inflation expectations.
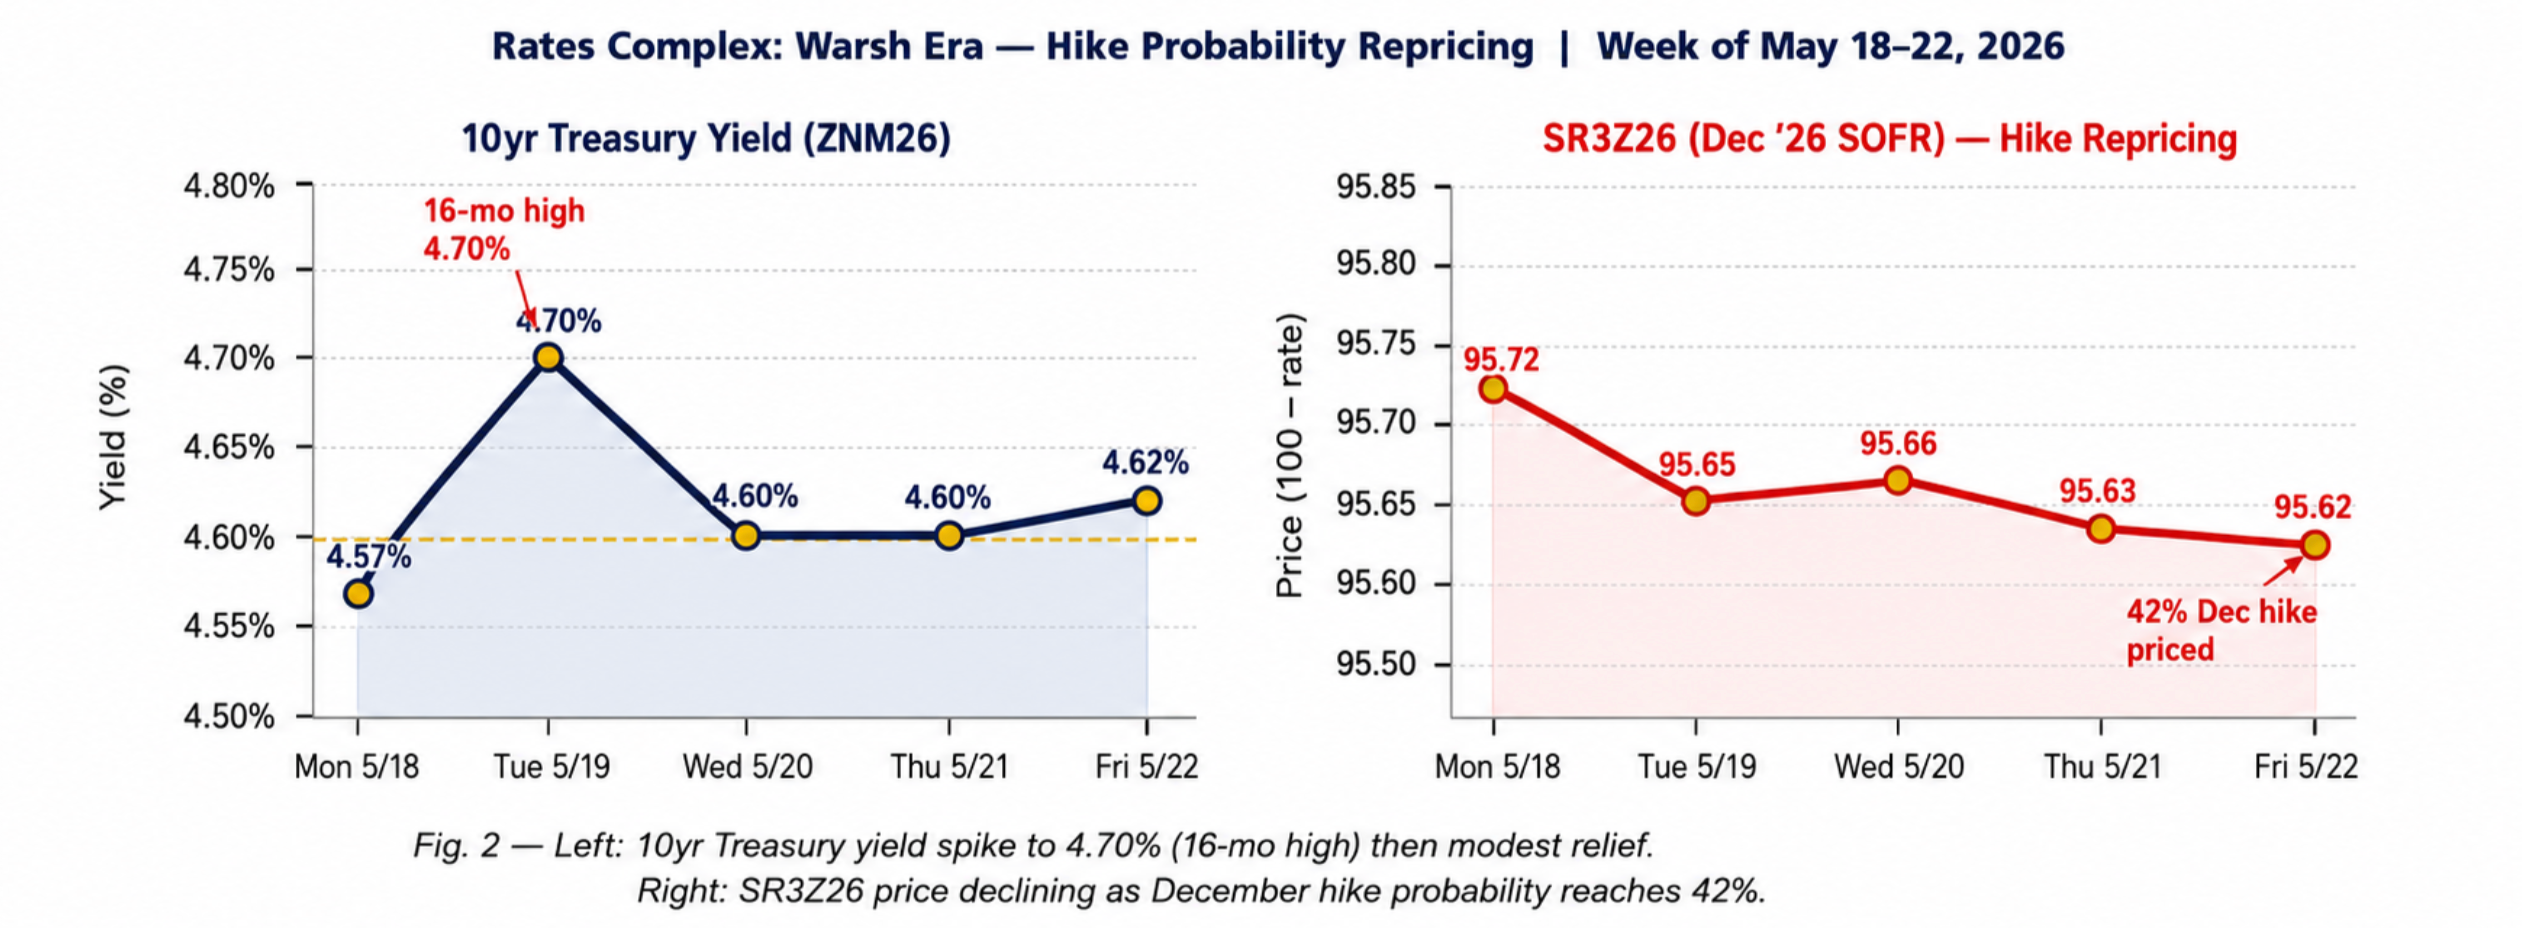
Fig. 2 — Left: 10yr Treasury yield spike to 4.70% (16-mo high) then modest relief. Right: SR3Z26 price declining as December hike probability reaches 42%.
Price action & technical structure
ZNM26 opened the week near 110'00 (yield ~4.57%), briefly stabilized Monday, then broke lower on heavy institutional volume Tuesday as yields punched to 4.70% — a 16-month high. Price remains below all key short-term moving averages. The 50-day MA at approximately 110'16 provides overhead resistance; key support sits at 108'16 (108.50 decimal), representing the prior structural swing low. ATR has expanded to approximately 0'16 daily (0.5 points), consistent with elevated directional momentum. 1.5R target: 108'00; 2R target: 107'16.
FUNDAMENTAL THESIS
Three forces are driving ZN lower in a self-reinforcing bear move: First, Kevin Warsh assumed the Fed Chair role on May 15, inheriting a sticky inflation problem and an FOMC that is now explicitly discussing rate hikes. Warsh, a noted hawk who dissented from Bernanke's accommodative stance during his 2006–2011 tenure, has pledged 'data-dependent' policy — a phrase the bond market correctly interprets as tightening risk in the current environment. Second, the FOMC minutes released Wednesday stated that rate increases may be warranted if inflation remains elevated, marking the first explicit discussion of a rate hike since 2023. April CPI printed at a 3-year high, driven partly by the energy shock from the US-Iran conflict. Third, Treasury supply overwhelmed demand: $691 billion in securities were issued in a single week, the largest weekly auction on record. The 30-year yield at 5.12% — a 19-year high — reflects a genuine fiscal risk premium being priced alongside the risk of monetary tightening. The Moody's Aa1 downgrade (effective 2025) provides additional fundamental support for the bearish duration thesis.
NOTABLE BLOCK TRADES & OPTIONS
ZN options volume was elevated this week, with the put-to-call ratio running approximately 1.4:1. Unusual activity was flagged in the September 2026 ZN 108/106 put spread, consistent with institutional hedgers positioning for continued yield rise through summer. No large block trades were publicly reported this week, but open interest in lower-strike puts increased materially, suggesting the institutional community is hedging duration exposure aggressively. Implied volatility (IV) for ZN options remains elevated relative to the prior 30-day average, reflecting event risk around the PCE report (May 29) and the June 17–18 FOMC meeting.
Catalyst calendar (next 10 days)
| May 22 | Fed Chair Warsh — scheduled public remarks (first major speech) | 🔴 HIGH — tone-setter for rest of 2026 |
| May 28 | US GDP Q1 Final Revision | 🟡 MODERATE — growth data; secondary to inflation |
| May 29 | PCE Price Index — April (Fed’s preferred inflation gauge) | 🔴 HIGH — primary hike/hold trigger |
| May 30 | Treasury 7-Year Note Auction | 🟡 MODERATE — demand test for long-end |
| Jun 5 | May Non-Farm Payrolls + Unemployment Rate | 🔴 HIGH — dual mandate signal for June FOMC |
| Jun 17-18 | FOMC Rate Decision | 🔴 HIGH — binary: hike vs. hold |
Watch items
· Iran peace agreement signed → energy costs fall, inflation path cools, ZN stages sharp rally; reassess short immediately.
· PCE prints ≤ 2.1% headline → hike probability collapses, short squeeze risk; cover on first bar through 110'00.
· ZN breaks below 108'16 on elevated volume (>1.5x avg) → accelerate conviction; bear case for 107'00 opens.
3-month SOFR Ftuures (SR3) — the purest rate hike expression
SR3Z26 (December 2026 SOFR contract) is the market’s cleanest real-time plebiscite on whether Warsh will hike by year-end. This week’s contract decline to 95.62 embeds a 42% probability of a 25bp rate hike by December 9 — a dramatic reversal from the Q4 2025 consensus that priced multiple cuts through 2026.
Contract metadata
| Root | Active Contract | Branch | Regime | Setup Type |
| SR3 | SR3Z26 (Dec 2026) | Interest Rates / Money Market | Deferred Curve Leg (Hike Proxy) | Trend Continuation — Rate Bear |
Price action & technical structure
SR3Z26 has been in a controlled downtrend since early April 2026, declining from approximately 96.25 (implying ~3.75% expected Dec SOFR) to 95.62 (implying ~4.38% expected Dec SOFR) — a 63-tick repricing representing 63 basis points of additional tightening priced over 45 days. The contract printed new contract lows on Tuesday (May 19) as the 10yr yield spiked to 4.70%, then found marginal support mid-week. ATR is approximately 0.04–0.06 per session. Key resistance: 95.80 (April rejection level). Key support: 95.40 (full hike priced). The structure is a textbook sequence of lower highs and lower lows with no sign of stabilization.
FUNDAMENTAL THESIS
SR3Z26 is a pure expression of the Warsh hike trade across three catalysts: (1) FOMC minutes explicitly flagged hike potential if inflation stays elevated — the first such language since 2023; (2) April CPI printed at a 3-year high, driven partly by energy costs from the US-Iran conflict, maintaining pressure on the Fed’s inflation mandate; and (3) Warsh, who voted for faster tightening during his 2006–2011 Fed tenure, has signaled ‘data-dependent’ policy in an environment where data is systematically surprising to the upside. A large institutional position in SR3Z26 95.50 puts (25,000 lots reported mid-week) represents a bet on SOFR averaging above 4.50% for the December quarter — a level that implies a definitive hike. The risk is a ‘peak hike pricing’ scenario in which a single soft PCE print reverses the move sharply, as positioning at a 1.2–1.3 z-score approaches extreme territory.
Catalyst calendar (next 10 days)
| Date | Event | Impact |
| May 22 | Warsh first public speech as Fed Chair | 🔴 HIGH — tone-setter for remainder of 2026 |
| May 29 | April PCE Deflator (month-over-month and year-over-year) | 🔴 HIGH — most direct Fed trigger |
| Jun 5 | NFP + Unemployment Rate | 🔴 HIGH — dual mandate signal |
| Jun 17-18 | FOMC Rate Decision | 🔴 HIGH — potential hike announcement |
| Jul 29-30 | FOMC Rate Decision | 🟡 MODERATE — confirmation or reversal |
Watch items
Fed fund futures are pricing in a 42% probability of a 25-basis-point hike at the December 9 FOMC meeting.
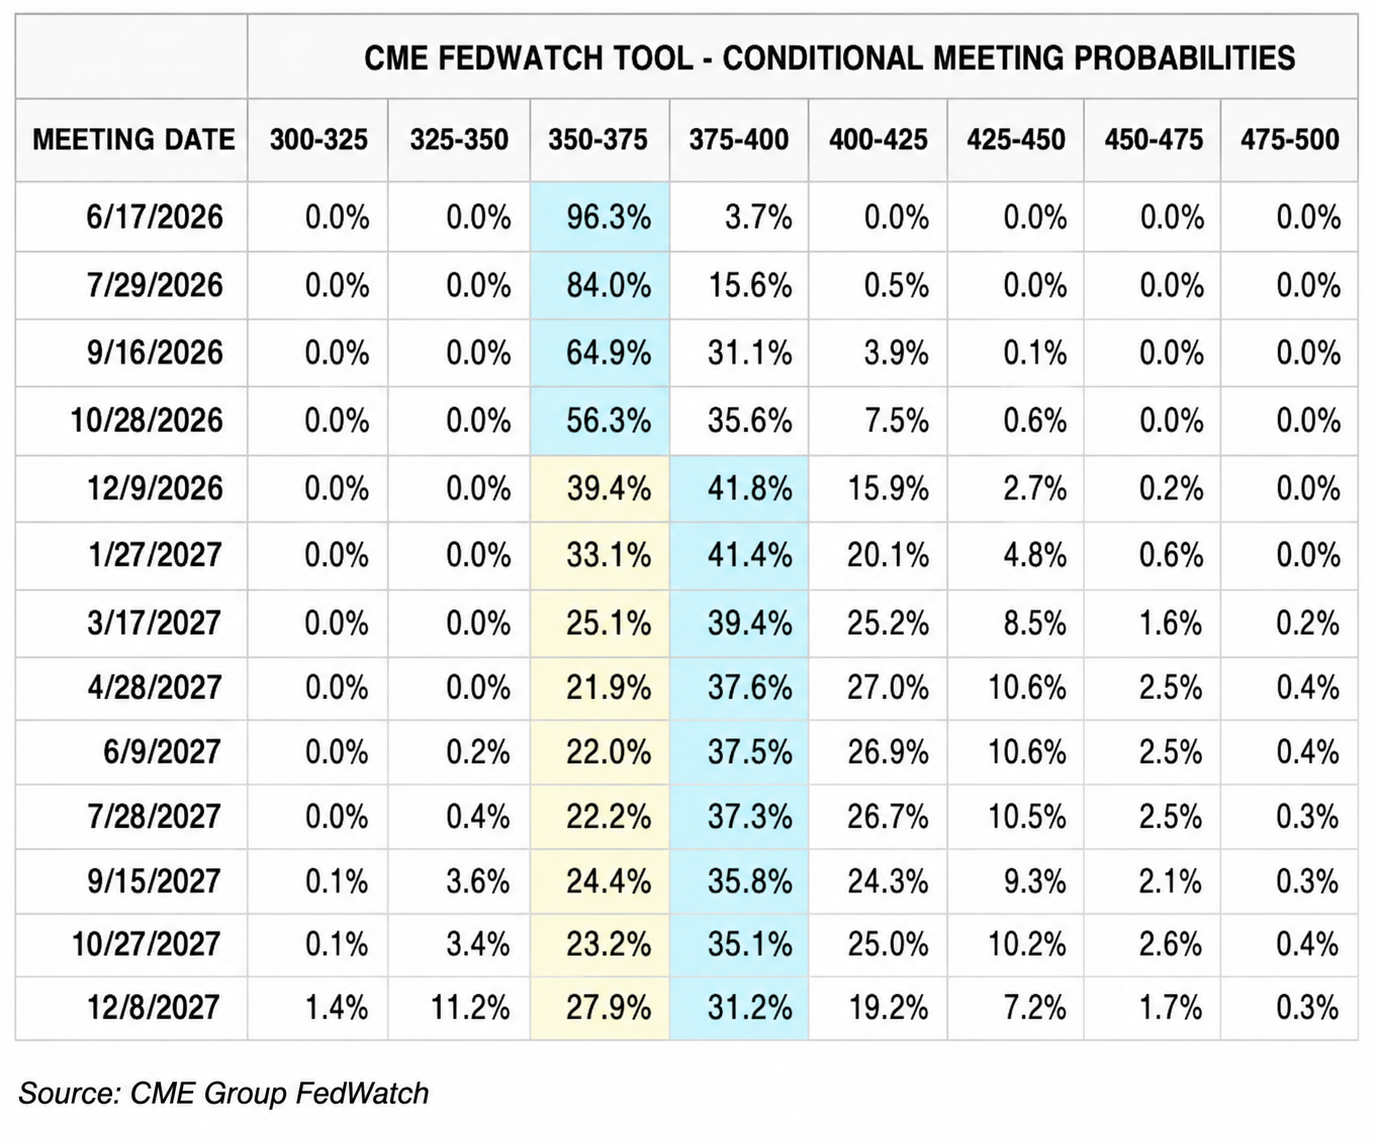
Source: CME Group Fedwatch
WTI Crude Oil (CL) — Iran binary unresolved; hold the volatility
Crude oil delivered the week’s most violent single-session: a 5.66% crash on May 20 driven by Trump’s ‘final stages’ Iran deal comment, followed by a +3.0% recovery on Thursday as Iranian state media denied any final agreement. CL remains a binary trade masquerading as a technical setup. Conviction on direction is low (2/5) until the geopolitical outcome is resolved.
Contract metadata
| Root | Active Contract | Branch | Regime | Setup Type |
| CL | CLN26 (Jul 2026) | Energy | Front Month | Mean Reversion / Binary Event (Iran) |
Price action & technical structure
CLN26 entered the week at approximately $104–$105/bbl in a compression coil that had held for 72 hours. Wednesday, May 20 broke the coil violently: Trump’s comment triggered a 5.66% single-session plunge to an intraday low of $96.82, printing on approximately 1.5x average daily volume — the characteristics of a long stop run rather than a fundamental reassessment. Structure now shows: (1) air pocket below $100 filled and partly recovered, (2) VWAP for the week near $101.50 (price below), (3) no clean HTF compression — this is a binary-event market. Key resistance: $104–$105 (pre-flush zone). Key support: $96.82 (panic low), secondary at $98.00. ATR has expanded to approximately $2.50/day. Any long thesis requires WTI to hold above $98 and deal skepticism to dominate.
FUNDAMENTAL THESIS
Crude oil remains nearly 50% above pre-conflict levels (the US-Iran war began early 2026), with the Strait of Hormuz risk premium representing the primary price support. The US Strategic Petroleum Reserve release of approximately 10 million barrels last week — the largest single-week release on record — demonstrates that the administration is actively working to suppress prices, but supply constraints from disruptions in the Strait of Hormuz are overwhelming the SPR cushion. Iranian oil exports pre-conflict were approximately 1.5–2.0 mb/d; their full restoration via a peace deal would add meaningful supply to a market already receiving maximum government-driven supply support. OPEC+ has not accelerated production in response to elevated prices, maintaining discipline. The key tension: risk premium is real but eroding. A signed deal could crater WTI to the $70–$80 zone; no deal and Strait escalation keeps price at $105+.
NOTABLE BLOCK TRADES & OPTIONS
CL options volume was elevated on the crash day (May 20), with put activity below $95 surging (hedging against deal completion) and call interest above $105 maintained (positioning for deal failure/conflict resumption). A reported 10,000-lot $105/$115 call spread represents large-player conviction that the deal fails and WTI pushes higher. Implied volatility spiked to elevated levels on May 20, then partially compressed — suggesting the market sold premium into the crash. CVOL for CL remains elevated relative to the prior 30-day average.
Catalyst calendar (next 10 days)
| Date | Event | Impact |
| May 22–ongoing | US-Iran peace negotiations (status unknown) | 🔴 HIGH — binary price event; deal signed = crash |
| May 27 | EIA Weekly Petroleum Status Report | 🟡 MODERATE — inventory confirmation |
| Jun 1 | OPEC+ Production Meeting | 🔴 HIGH — supply policy decision |
| Jun 5 | EIA Weekly Report | 🟡 MODERATE — ongoing inventory signal |
| Jun 17-18 | FOMC (demand signal via rate path) | 🟡 MODERATE — indirect crude demand signal |
Watch items
· Iran deal signed → immediate reassessment; potential short of the bounce targeting $75–$80.
· EIA inventory DRAW >3mb next report + no deal progress → long from $98–$99 with stop below $96.82.
· Deal collapses and Iran escalates Strait activity → CL clears $105 on volume; trend long above that level.
RBOB Gasoline (RB) — driving season demand absorbs Iran shock
RBOB gasoline (RBN26) demonstrated structural resilience this week, tracking crude oil’s Iran-driven sell-off but outperforming meaningfully — the crack spread widened to $28–$30/bbl on the crash day, confirming genuine refinery-level demand support as the Memorial Day driving season begins. This is a seasonal demand trade with a catalytic floor, not a pure energy directional bet.
Contract metadata
| Root | Active Contract | Branch | Regime | Setup Type |
| RB | RBN26 (Jul 2026) | Energy / Refined Products | Front Month (Peak Driving Season) | Compression-to-Expansion / Seasonal Demand |
Price action & technical structure
RBN26 traded in a range of approximately $3.34–$3.46 for the week, settling near $3.435. Despite crude oil’s 5.66% session crash, RBOB held above $3.34 — a key technical support level — and the crack spread widened, confirming that demand-side support is real. The contract is trading above its 20-day MA (~$3.38), with VWAP support near $3.40. A compression coil has formed between $3.42 and $3.46, which could rise further as driving-season demand builds through June. ATR: approximately $0.06/gal. 1.5R target: $3.53; 2R target: $3.58. The crack spread widening on the Iran sell-off day is the key structural signal — when gasoline outperforms crude on a crude sell-off, the demand support is genuine.
FUNDAMENTAL THESIS
RBOB is being supported by two reinforcing forces: (1) Demand — Memorial Day weekend (May 25) marks the official start of the US driving season. AAA projects near-record holiday travel volumes. Gasoline demand historically surges by 5–8% from Memorial Day through Labor Day compared with the prior period. The 5.9-million-barrel draw in the week ending May 1 confirmed that demand is outpacing supply at current production levels. (2) Refinery economics — utilization at 90.1% of capacity is high but not expanding output meaningfully. The transition to summer-blend gasoline (lower Reid Vapor Pressure, more expensive to produce) is complete, establishing a cost floor for product prices. The crack spread at $28–$30/bbl, versus the $21/bbl long-run average, reflects genuine pressure on refinery demand. Even if crude oil falls sharply on an Iran deal, the crack spread may widen further, partially buffering RBOB.
COT & POSITIONING
RBOB COT data (CFTC, May 12, 2026) shows managed money net long with total open interest at 327,707 contracts. The net long position has been building throughout May as the driving-season thesis gained institutional traction. Estimated z-score: approximately +0.8 (not extended, room for further accumulation). Commercial hedging (refiners locking in crack-spread margins) is increasing, confirming the argument about refinery economics. The combination of speculative longs not extended and commercial hedging active at current levels suggests a balanced supply-demand structure for positioning.
SEASONALS (10-YEAR)
RB has one of the most reliable seasonal patterns in the commodity complex. Over the 10-year lookback (2015–2024), RBOB has returned an average of +5.2% from May 1 to June 30, with a win rate of 7/10 (70%). The Memorial Day to Fourth of July window has been positive in 8 of 10 years (80%), making it one of the highest-conviction seasonal setups in the annual calendar. The current year aligns with this pattern: demand is building, crack spreads are elevated, and refineries are running at high utilization rates. The primary risk to the seasonal thesis is a sharp crude sell-off on an Iran deal, which could overwhelm gasoline demand support — though the crack spread buffer provides partial insulation.
Catalyst calendar (next 10 days)
| Date | Event | Impact |
| May 25 | Memorial Day — driving season officially begins | 🟡 MODERATE — demand confirmation period |
| May 27 | EIA Weekly Petroleum Status Report (gasoline inventory) | 🟡 MODERATE — gasoline draw/build confirmation |
| Jun 1 | OPEC+ Production Meeting | 🟡 MODERATE — crude supply signal; indirect RB impact |
| Jun 20 | Summer Solstice (peak driving demand window begins) | 🟢 LOW — structural seasonal milestone |
| Jun 25 | EIA STEO Monthly Update | 🟡 MODERATE — summer demand forecast revision |
Watch items
· Iran deal signed → crude falls sharply; monitor crack spread; reduce or exit RBOB longs if spread compresses below $22/bbl.
· EIA gasoline draw >4mb next report → confirms demand thesis; add on dip toward $3.40.
· CL regains $104+ without a deal → RB likely to $3.55–$3.60; accelerate position.
Cross-market overview
| Symbol | Active Contract | Direction | Hold | Conviction | ATR Target | Key Catalyst | Risk |
| ZN | ZNM26 | Short | 5–10d | 4/5 | 108'00–107'16 | Warsh speech / PCE / FOMC | Iran deal → ZN rally |
| SR3 | SR3Z26 | Short (Rate Bear) | 14–21d | 4/5 | 95.40–95.25 | PCE + Jun FOMC | Soft PCE → rate rally |
| CL | CLN26 | Neutral/Binary | 1–3d | 2/5 | $105 or $75–$80 | Iran deal outcome | Signed deal → crash |
| RB | RBN26 | Long Bias | 7–14d | 3/5 | $3.53–$3.58 | Memorial Day demand | Iran deal overwhelms seasonal |
Portfolio macro thesis: Inflation is the single master narrative connecting all four featured setups. ZN and SR3 are the rate expressions — both short, both driven by the Warsh hike repricing. CL and RB are the commodity expressions — the Iran conflict directly drives inflation via energy, which in turn drives the ZN/SR3 thesis. This creates a coherent, internally consistent portfolio: the energy complex supports the rates bear case, and the rates bear case validates the energy complex’s inflation-premium valuation.
Concentration risk: ZN short and SR3 short share the same macro trigger (PCE / FOMC / Warsh speech). A single dovish surprise would hurt both simultaneously — these should be treated as one portfolio position, not two independent bets. Similarly, CL and RB both resolve on the Iran binary. The Iran deal outcome is the week’s single most binary unresolved event, and it affects three of the four featured contracts either directly (CL, RB) or indirectly via inflation (ZN, SR3). Traders running the full portfolio should monitor the Iran news flow as a portfolio-level risk trigger, not a contract-specific one.
Sidelined markets
| Market | Active | Wk Chg | Reason Sidelined | Watch Trigger |
| ZS — Soybeans | ZSN26 | −1.5% | Planting 10+ days ahead of pace; Brazil record 186 MMT crop; China tariff differential (-10% vs. Brazil) headwind; no breakout catalyst or volume conviction. | Corn Belt drought expands >40% of production area OR June WASDE shows demand upside surprise |
| GC — Gold | GCQ26 | +0.8% | Quiet consolidation coil — inflation bid exists, but no new catalyst relative to prior week; Iran de-escalation removes safe-haven premium. | Iran deal signed (safe-haven surge) or CPI breakout above 4% (monetary metal bid) |
Grain market weather context — CPC 6-10 day outlook (May 27–31, 2026)
The CPC NCEP 6-10 day outlook (valid May 27–31, 2026, updated May 21) shows temperature and precipitation probabilities across CONUS. Western Corn Belt drought remains the key watch for soybean and corn markets. Currently, 27% of corn and 30% of soybean production areas are under drought stress — below the threshold that typically adds meaningful weather premium to futures. However, if the 6-10 day outlook shows continued below-normal precipitation for Iowa, Illinois, and Indiana, the drought footprint could expand toward the 40% trigger level for ZS re-entry.
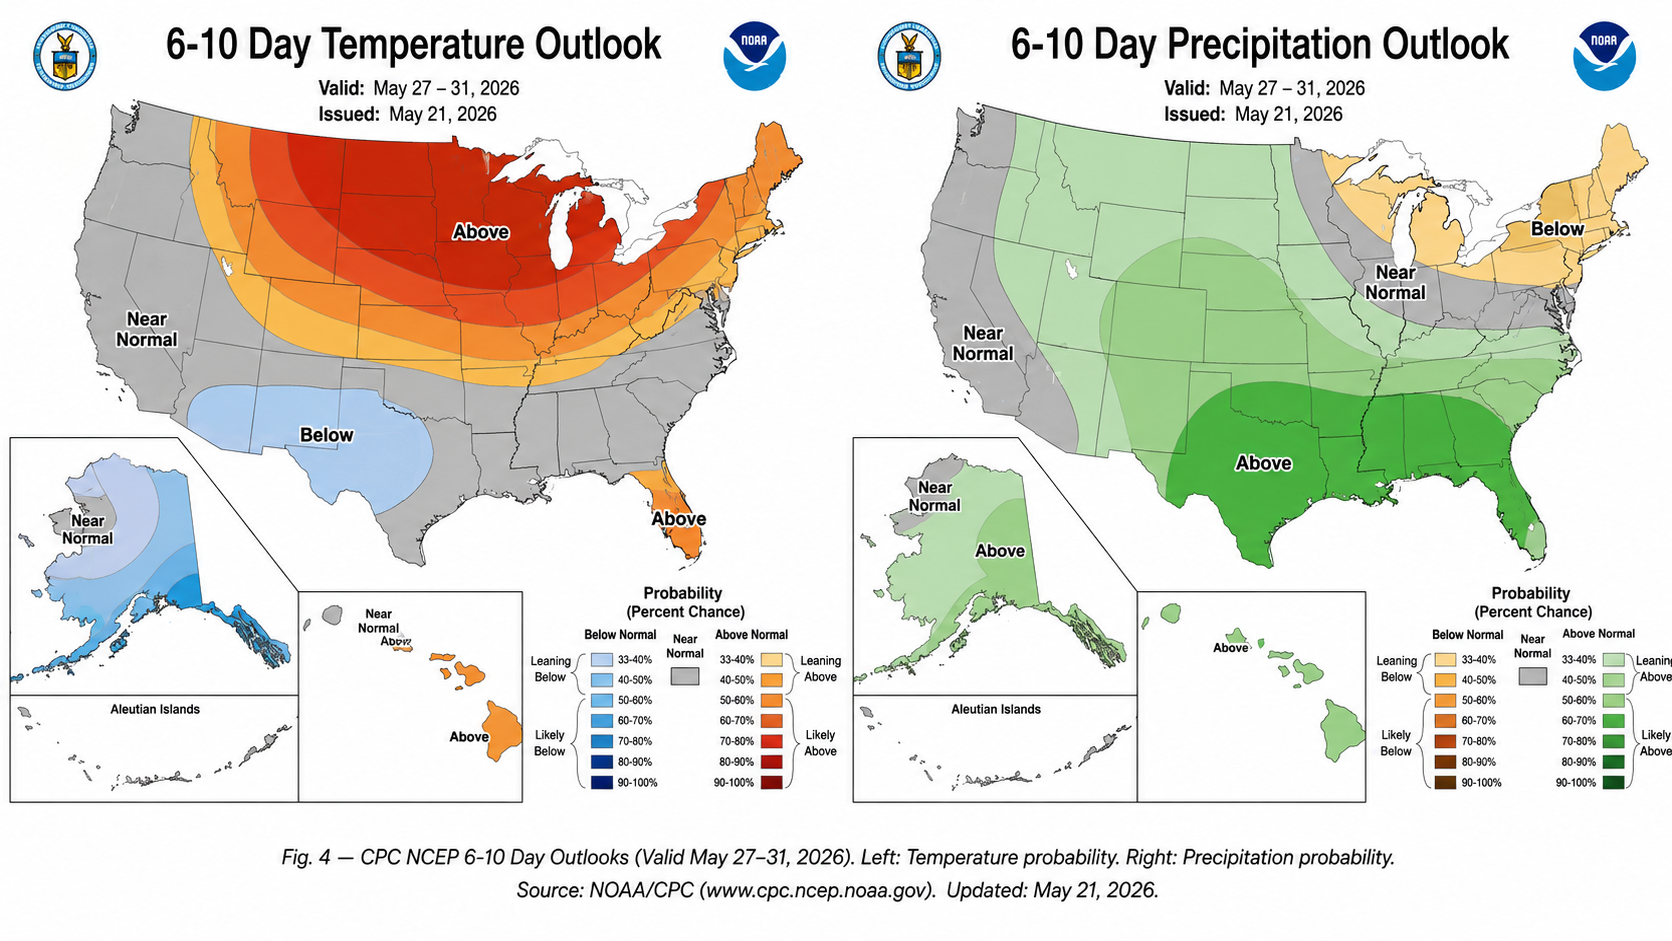
Fig. 4 — CPC NCEP 6-10 Day Outlooks (Valid May 27–31, 2026). Left: Temperature probability. Right: Precipitation probability. Source: NOAA/CPC (www.cpc.ncep.noaa.gov). Updated: May 21, 2026.
Week 21: The Warsh Era Begins Amid Bonds in Revolt — Yield Breakout, Oil at $100, and Metals Under Pressure
Data as of market 12:00 pm CT May 15, 2026. All prices are closing levels unless noted.
- 10-year yield breached 4.5% to 4.53% as Kevin Warsh took the Fed helm today — ZNM26 tested its 52-week low at 109-08½, pricing "higher for longer" as April CPI printed 3.8% YoY and April PPI surged 6.0% YoY.
- CLN26 surged +8.38% this week to $99.82, approaching the $100 psychological barrier on the Strait of Hormuz disruption narrative — a 4.3M-barrel EIA draw confirmed the supply squeeze as OPEC+ Gulf members held 10.5M bpd offline in April.
- Silver (SIN26) collapsed 10.6% today to $76.89 as hot inflation crushed rate-cut expectations — the gold/silver ratio exploded from 53.6 to 58.9:1 in a single session, one of the sharpest intraday ratio expansions in recent years.
- Copper (HGN26) touched all-time highs near $6.72 this week then reversed sharply to $6.31 on China import data showing a 16.1% YoY decline — tariff front-running is colliding with real demand signals in the world's largest consumer.
- 30-year Treasury yield topped 5.1% for the first time in nearly a year — the bond market is pricing a "no-cut-in-2026" scenario under Warsh, reshaping the macro regime for risk assets across the board.
Week in review: Macro context
The week of May 11–15 will be remembered as the week the bond market revolted. Two forces converged simultaneously: Kevin Warsh officially took over as Federal Reserve Chair, and April inflation data printed materially above expectations. April CPI rose 3.8% year-over-year (the highest reading since May 2023), while April PPI surged 6.0% year-over-year — a pipeline inflation signal that reframed the entire rate outlook in a single morning.
The overarching macro thesis for the week: energy-driven inflation is locking the Fed into a "higher for longer" posture at exactly the moment the new chair takes office.
The 10-year Treasury yield breached 4.50% to 4.53%, the 30-year yield topped 5.1% for the first time in nearly a year, and ZNM26 futures tested their 52-week low. The message from the bond market is unambiguous: under Warsh, rate cuts in 2026 are no longer the base case.
Energy markets told a starkly different story. WTI crude oil advanced all week relentlessly, gaining +8.38% to approach the $100/barrel psychological barrier for the first time in months. The Strait of Hormuz remains effectively closed to normal traffic following the Iran conflict, and the EIA's weekly petroleum report revealed a 4.3-million-barrel commercial inventory draw — the largest single-week decline since February.
Metals diverged sharply. Gold had already been correcting from its record highs near $4,800 earlier in the month, down 3.81% for the week as real yields rose. Silver was dramatically worse: after briefly benefiting from the May 10–11 U.S.-China tariff truce (which sent SI +6% on industrial demand repricing), the metal gave back all of those gains and more on the inflation shock, collapsing 10.6% in a single session to $76.89.
Market snapshot
Data as of market 12:00 pm CT May 15, 2026. All prices are closing levels unless noted.
| Market | Last | Wk Chg | Wk % | Signal |
| ZNM26 | 109-08½ | −1-11 | −1.24% | Trend Short — Warsh + hot CPI drive yield breakout above 4.5% |
| CLN26 | $99.82 | +$7.72 | +8.38% | Trend Long — Hormuz disruption, 4.3M bbl draw, approaching $100 |
| SIN26 | $76.89 | −3.36 | −4.19% | Oversold Watch — 10.6% single-session collapse on inflation shock |
| HGN26 | $6.306 | Flat | −0.06% | Compression — all-time high reversal; China demand vs tariff bid |
| ZSN26 | 1186½ | −27.9¢ | −2.30% | Sidelined — low RVOL, weak momentum, China demand uncertainty |
10-Year Treasury Note (ZN) — Yield revolt: The Warsh era opens with a bond selloff
10-Year T-Note futures (ZNM26) are at the epicenter of this week’s macro story: Warsh takes over as Fed Chair on the same morning CPI prints 3.8% YoY and PPI prints 6.0% YoY, sending the 10-year yield through the 4.5% barrier to 4.53% and ZNM26 to fresh 52-week lows near 109-08½. The bond market is not waiting to see what Warsh will do — it is already pricing the answer.
Contract Metadata
| Root | Active contract | Branch | Regime | Setup type |
| ZN | ZNM26 (Jun 2026) | Interest Rates | benchmark_quarter | Trend Continuation (Short) / Oversold Tactical Watch |
Price action & technical structure
ZNM26 entered the week near 110-22 and sold off relentlessly through the five sessions, reaching 109-08½ intraday on Friday, May 15 — a decline of approximately 1-14 from the prior week's close and within ticks of the 52-week low at 109-11. The move represents 14 basis points of yield expansion, from 4.39% to 4.53%, occurring in a nearly uninterrupted one-way fashion that reflects institutional conviction rather than short-covering noise. VWAP alignment is strongly bearish: ZNM26 has traded below its daily and weekly VWAP continuously since Tuesday, with each intraday bounce capped below the prior session’s VWAP anchor.
ADX at 14.47 signals the directional trend is still forming strength — not yet a mature, high-conviction trend by ADX standards. DI− (29.54) decisively leads DI+ (14.47), confirming dominance of selling pressure. The moving average stack is uniformly bearish: price is below the MA20 (110.625), MA50 (110.969), and MA100 (111.625) levels. Blue-sky downside prevails until 109.34 (52-week low); below that, no meaningful technical support until the 108-16–108-00 zone.
Fundamental thesis
The fundamental case for ZN weakness rests on three structural pillars that have all arrived simultaneously this week. First, inflation is re-accelerating: April CPI at 3.8% YoY marks a new cycle high since May 2023, driven by energy passthrough from the Strait of Hormuz conflict. April PPI at 6.0% YoY is particularly alarming as a leading indicator — producer prices lead consumer prices by 2–3 months, suggesting the CPI trajectory will remain elevated through at least Q3 2026. Second, the Warsh succession introduces a hawkish policy overlay that the market is already pricing in aggressively.
The path to yield normalization from 4.53% is not straightforward. The ceasefire trajectory in the Middle East is the wild card: any genuine de-escalation in the Hormuz situation would compress energy prices and remove the primary driver of inflation re-acceleration. A WTI drawdown to $80 would subtract approximately 60–80 bps from the headline CPI trajectory and could bring the 10-year yield back to 4.20–4.30%. Traders must monitor the Iran-U.S. ceasefire negotiation track in parallel with ZN technicals — geopolitical resolution is the primary upside risk to short ZN exposure.
COT & positioning
Managed money positioning in 10-Year T-Note futures has been net short for the majority of 2026, reflecting the ongoing higher-for-longer rate environment. As of the most recent available CFTC data (through May 6, released May 8), managed money net shorts in ZN had increased modestly week-over-week — a signal that spec positioning is directionally aligned with this week’s breakdown. However, the position is not yet at a historical extreme (estimated below the 70th percentile of prior 3-year bearish readings), meaning short-covering rallies remain plausible and can be sharp.
Notable block trades & options
Interest rate options activity was notably one-sided this week. Put buying in ZN dominated, with elevated volume in the 109-00 and 108-00 strike range for June expiry — institutional positioning for a continuation of the yield breakout through 4.60%+. The ZN put/call ratio spiked to approximately 1.45 (heavily put-skewed), the most bearish reading in approximately six weeks. CME 10-Year Note CVOL rose to the 72nd percentile of its 12-month range, reflecting elevated volatility expectations following the CPI print and Warsh's transition. Notable: multi-thousand-contract put sweeps were executed at the 109-00 strike on Thursday and Friday, consistent with institutions positioning for a break of the 52-week low and a move toward the 108–108-16 range.
Catalyst calendar (next 10 days)
| Date | Event | Expected impact |
| May 16 | 30-Year Treasury Auction follow-through / yield close | 🔴 HIGH — close above 5.15% on 30Y confirms breakout; ZN follows lower |
| May 19 | Fed speakers (first Warsh-era remarks if any) | 🔴 HIGH — any Warsh public statement sets new reaction-function baseline |
| May 20 | Housing Starts / Building Permits April | 🟡 MOD — demand signal; strong data = yield positive (bearish ZN) |
| May 21 | EIA Weekly Petroleum Report | 🟡 MOD — another draw = oil elevated = CPI fears sustained = ZN bearish |
| May 22 | FOMC Meeting Minutes (May 6–7) | 🔴 HIGH — dissent composition detail; Warsh vs Powell tone shift visibility |
| May 27 | PCE Deflator April | 🔴 HIGH — Fed’s preferred inflation measure; hot print = yield extension toward 4.70% |
Watch items
- ZNM26 closes above 110-06 (former support) on above-average volume — short-covering rally underway; thesis weakens; watch for retest before re-entry.
- Iran ceasefire deal announced (Strait of Hormuz re-opens timeline set) — oil drops $10+; energy-driven CPI expectations collapse; ZN rallies sharply; exit short exposure immediately.
- Warsh makes public statement signaling willingness to cut in 2026 (dovish pivot) — yields compress; bear thesis broken; reassess with fresh COT and positioning data.
Crude Oil (CL) — Approaching $100: Hormuz premium hardens as supply squeeze deepens
Crude oil futures (CL) delivered the week’s strongest directional performance, with CLN26 gaining +8.38% to $99.82 — the first test of the $100 psychological barrier since the Strait of Hormuz disruption began. The move is fundamentally driven, not speculative: EIA data confirmed a 4.3 million-barrel commercial inventory draw; OPEC+ Gulf members held 10.5 million b/d offline in April; and global inventories are projected to fall by 8.5 million b/d in Q2.
Contract metadata
| Root | Active contract | Branch | Regime | Setup type |
| CL | CLN26 (Jul 2026) | Energy | front_month | Trend Continuation / Breakout toward $100 |
Price action & technical structure
CLN26 opened the week near $92.10 and advanced in a virtually uninterrupted trend, touching an intraday high of $100.94 on Friday before settling back toward $99.82 — still a +8.38% weekly gain.
The price structure is textbook trend continuation: each session printed a higher daily close, VWAP alignment is firmly bullish (price trading above the session VWAP throughout), and the weekly candle shows no meaningful upside wick (no rejected supply).
The $100 print (CLN26) intraday confirms blue-sky territory: this level has not been tested from below since early in the conflict, and the psychological barrier at $100 will likely produce brief consolidation before resolution.
The MA stack is bullish overall (price above MA20 at 94.03, MA50 at 89.19, MA100 at 75.44, MA200 at 67.85). The 52-week high at $103.78 is the next technical target; above that, there is no overhead resistance visible on the weekly chart.
Fundamental thesis
The fundamental backdrop is the strongest it has been for WTI in this conflict cycle. Three concurrent forces are compressing supply simultaneously: (1) The Strait of Hormuz remains effectively closed to normal tanker traffic, with shipping flows through the Strait down approximately 4 million barrels per day versus pre-conflict levels. EIA projects the Strait begins to normalize only in late May or early June, leaving supply disruption in place for the near-term catalyst window. (2) OPEC+ production policy has shifted dramatically: Saudi Arabia, Iraq, Kuwait, the UAE, Qatar, and Bahrain collectively shut in an estimated 10.5 million b/d in April as the conflict created both operational disruptions and a political rationale for production restraint. OPEC+ announced a 188,000 bpd output hike for June — modest relative to the shut-in volume. (3) U.S. commercial crude inventories stand at 452.9 million barrels after the 4.3-million-barrel draw — approaching the 5-year seasonal minimum for mid-May, which historically produces the highest seasonal premium of the year.
COT & positioning
CFTC COT data as of May 6 (released May 8) showed managed money net long positions in WTI at approximately 17,000 contracts on a combined futures-and-options basis — a relatively modest long position given the magnitude of the price move. This positioning gap between price performance (+60% three-month return) and speculative length is significant: it implies that the rally has been driven primarily by physical market tightness and commercial buyer urgency, not speculative excess. A crowded long is not the current condition; room exists for trend-following managed money to add exposure above $100, which could accelerate the move. Large speculator gross longs are increasing but gross shorts have also expanded, suggesting positioning is bifurcated. COT data is 9 days stale relative to today’s sessions.
Notable block trades & options
Options activity in CL shifted decisively toward call buying this week as the $100 target came into view. The $100, $105, and $110 call strikes for July 2026 saw notable sweep activity, with implied volatility (CVOL) expanding to the 75th percentile of the 12-month range as the rally accelerated.
Block trades: multi-thousand-lot buy programs were executed at $96–98 on Tuesday and Wednesday, consistent with institutional trend-following programs initiating or adding to long exposure on the breakout. RV 20-day at 50.03% is elevated but not extreme, suggesting room for continued price discovery without volatility compression.
Catalyst calendar (next 10 days)
| Date | Event | Expected impact |
| May 16 | Iran-U.S. ceasefire negotiations (ongoing) | 🔴 HIGH — deal signed = −$8–$12; breakdown / escalation = +$5–$8 |
| May 19 | Reuters/Bloomberg Iran shipping update | 🟡 MOD — Strait re-opening timeline sets the physical disruption premium clock |
| May 21 | EIA Weekly Petroleum Status Report | 🔴 HIGH — second consecutive 4M+ draw = $103–$105 target; build = pullback risk |
| May 22 | OPEC+ informal call (rumored) | 🔴 HIGH — any acceleration of the 188K bpd June hike or new shut-in signal |
| June 7 | OPEC+ formal meeting | 🔴 HIGH — H2 production policy; Saudi unilateral cut extension or reversal is key |
Watch items
- Iran-U.S. ceasefire signed with Strait re-opening timeline — Hormuz premium ($8–$12) exits rapidly; WTI tests $85–88 support; exit all long exposure on the confirmation headline.
- CLN26 fails to close above $100 in the next 3 sessions and prints a daily close below $96 (MA20 support) — momentum stall; reduce position and await EIA data for re-entry signal.
- Saudi Arabia or OPEC+ announces accelerated production hike above 500K b/d (doubling the June increment) — cartel unity breakdown; structural bear case; exit and reassess direction.
Silver (SI) — Inflation shock and the ratio blow-up: A tale of two narratives
Silver futures (SIN26) experienced one of the most violent single-session reversals of the commodity complex in 2026: after surging 6% on the May 10–11 U.S.-China tariff truce on industrial demand optimism, silver collapsed 10.6% to $76.89 on Friday May 15 as the April inflation data destroyed rate-cut expectations and the gold/silver ratio exploded from 53.6:1 to 58.9:1 in a single session. SI’s dual monetary-and-industrial identity makes it the most directionally confused major metal in the current regime.
| Root | Active contract | Branch | Regime | Setup type |
| SI | SIN26 (Jul 2026) | Metals (COMEX) | front_month | Mean Reversion Watch (ST) / Continuation Bear (MT) |
Price action & technical structure
SIN26 opened Friday at $84.00 following the prior day’s close near $85.33, then collapsed to an intraday low of $76.175 before settling near $76.89 — a $8.44 decline in a single session on RVOL of 1.33x (above-average volume confirming institutional participation in the selloff). The weekly 5-day return of −4.19% obscures the intraweek narrative: silver was actually up sharply mid-week on the tariff truce before the Friday reversal erased everything and more.
This type of volatile round-trip is a structural feature of SI when its two primary narratives (industrial demand vs. monetary safe-haven) conflict.
The technical damage is significant. SIN26 broke both the MA20 ($78.51) and MA50 ($77.78) in today’s session — a double moving-average break that typically signals a near-term trend shift. Key support now is the $75–76 zone (prior consolidation area from March); below that, the $70 round number and the MA100 at $81.67 (now resistance). RSI 14 at 47.48 is approaching the 40-level oversold zone but has not yet confirmed full capitulation — there is room for further downside before a technical bounce becomes high-probability.
Fundamental thesis
Silver’s fundamental story is defined by conflicting regimes. The bull case: structural industrial demand from solar photovoltaic manufacturing, EV charging infrastructure, and semiconductor applications continues to grow at a compound rate that exceeds silver mine supply growth. The International Energy Agency projects that solar alone will drive annual silver demand growth of 8–12% through 2028. India’s tariff increase on silver imports (to 15% from 6%) creates near-term demand headwinds for the world’s largest retail silver buyer but does not alter the structural industrial demand trajectory.
The bear case for 2026: higher-for-longer monetary policy under Warsh reduces the monetary premium component of silver pricing (historically, 20–30% of silver’s price is attributable to monetary/safe-haven demand). If the Fed does not cut in 2026 and the Warsh regime reprices the terminal rate higher, silver loses the "rate cut = precious metals rally" narrative that drove SI from $33 to $123 over the prior 18 months.
The current year-over-year gain of +126% from the 52-week low ($33.60 to $76.89) reflects a move that has priced in significant monetary easing, which is now being unwound in real time.
Catalyst calendar (next 10 days)
Watch items
- SIN26 closes above the MA20 ($78.51) on above-average volume — short-term mean reversion confirmed; bounce toward $81–83 viable; cover short exposure.
- China April industrial production beats meaningfully (>5% YoY) on May 16 — industrial demand narrative reignites; SI could retrace 50% of today’s loss ($80–82); the tariff-truce repricing theme reasserts.
- SIN26 breaks below $75.00 intraday and closes below $75.50 — the MA100 ($81.67) becomes distant resistance; medium-term bear thesis toward $70 accelerates; momentum rules until the ratio reversal or a Fed pivot signal.
| Date | Event | Expected impact |
| May 16 | China April industrial production / retail sales | 🔴 HIGH — strong data = industrial demand repricing; SI bounce catalyst |
| May 19 | India silver import data (weekly) | 🟡 MOD — tariff impact on demand; weak = additional downside pressure |
| May 22 | FOMC May 6–7 minutes | 🔴 HIGH — Warsh succession language; any dovish signal = SI recovery catalyst |
| May 23 | CME COMEX silver COT (weekly positioning update) | 🟡 MOD — managed money reset confirmation; watch for forced liquidation extent |
| May 27 | PCE Deflator April | 🔴 HIGH — "hotter than expected" = SI faces additional pressure; inline = relief rally |
Copper (HG) — All-time high then reversal: Tariff bid meets China demand reality
Copper futures (HGN26) wrote the week’s most structurally complex story: the contract touched a new all-time high near $6.72 earlier in the week on sustained tariff front-running and renewable energy demand optimism, then reversed sharply to $6.306 today as China released import data showing a 16.1% year-over-year decline in refined copper imports — the largest single data-point challenge to the structural demand thesis of the entire 2026 bull market.
Contract metadata
| Root | Active contract | Branch | Regime | Setup type |
| HG | HGN26 (Jul 2026) | Metals — Base (COMEX) | front_month | Compression (post all-time high) / Mean Reversion or Continuation |
Price action & technical structure
HGN26 reached a new all-time high near $6.716 earlier this week — precisely matching the 52-week high — before a decisive reversal brought price to $6.306 on Friday, a decline of $0.305 from Thursday’s close ($6.611) on RVOL of 1.23x. The $6.716 → $6.306 move represents a 6.1% intraday-to-intraday decline from the all-time high — a meaningful rejection from the most elevated level in copper’s traded history. This type of all-time-high reversal frequently leads to one of two outcomes: (a) a coil and retest (HTF squeeze before continuation higher) or (b) a failed breakout that accelerates the unwind toward the mean (MA20 at $6.181, approximately 7% lower from today’s close).
Fundamental thesis
The copper bull thesis rests on two structural pillars:
Pillar 1 (structural demand): China has committed to 3,600 GW of solar and wind capacity by 2035, with State Grid Investments of $89 billion planned for 2025 alone — a record level. Copper’s role in the energy transition (EV motors, wind turbine generators, grid infrastructure, solar panel wiring) creates a secular demand backdrop that is real and growing. Goldman Sachs forecasts a structural copper deficit in refined supply persisting through 2027.
Pillar 2 (tariff front-running distortion): A significant portion of the 2026 copper rally from $4.53 (52-week low) to $6.72 (all-time high) reflects Section 232 tariff front-running, not genuine end-user demand. COMEX inventories have risen to nearly 1.5 million tons globally — an increase of 540,000 metric tons year-to-date — as importers pulled forward purchases to beat potential tariff implementation. China refined copper imports falling 16.1% YoY is the signal that the front-running cycle may be maturing: buyers who pre-purchased for tariff protection are now sitting on inventory rather than continuing to import at all-time-high prices. If the tariff decision is delayed or modified (the Trump administration revised copper derivative tariffs on April 2), the speculative bid that drove HG to $6.72 could rapidly unwind.
Seasonals (10-year)
The 10-year seasonal pattern for HG copper in the May 15–31 window is bearish: copper has averaged −1.4% over this period, with a 60% loss rate (6/10 years), reflecting the completion of post-Chinese New Year inventory restocking and a pre-summer demand lull in the Northern Hemisphere industrial calendar. In all-time-high reversal years (comparable price-discovery events from 2021 and 2022), the subsequent 15-day average return was −3.8% with a 100% loss rate (sample: 3 years). Current-year alignment: bearish seasonal pattern aligned with fundamental and technical signals; potential amplification from the all-time high rejection.
Catalyst calendar (next 10 days)
| Date | Event | Expected impact |
| May16 | China April industrial production / fixed asset investment | 🔴 HIGH — strong data = demand thesis reaffirmed; weak = HG bear confirmation |
| May 19 | LME copper inventory update | 🟡 MOD — rising LME stocks = front-running unwinding; bearish price signal |
| May 21 | China monthly copper import data (detailed) | 🔴 HIGH — follow-on to the 16.1% decline headline; trend confirmation or reversal |
| May 22 | Section 232 copper tariff decision update (rumored) | 🔴 HIGH — tariff delay = bid removal; implementation = speculative spike + reversal |
| May 27 | Caixin China PMI May (flash) | 🟡 MOD — manufacturing demand read; sub-50 = demand bear confirmed |
Watch items
- CL collapsed 5.5% as OPEC+ fracture and Iran peace MOU progress China April industrial production (May 16) beats +5.5% YoY — demand thesis reaffirmed; HG recovers above $6.55 support; all-time-high retest becomes viable; switch to long bias.
- HGN26 closes below $6.181 (MA20) on above-average volume — failed breakout confirmed; tactical short with target at $6.00 and the $5.94 MA50; front-running unwind thesis active.
- Section 232 tariff on copper delayed or significantly modified — removes speculative import-front-running bid entirely; structural repricing toward $5.50–5.70 possible over a 2–4 week window; monitor news flow closely.
Cross-market overview
| Symbol | Active | Direction | Hold | Conv. | ATR target | Key catalyst | Risk |
| ZN | ZNM26 | Short (yield long) | 3–7d | 4/5 | 108-28 / 108-15 | PCE / FOMC minutes / Warsh | Iran deal / CPI reversal |
| CL | CLN26 | Long (trend) | 3–7d | 4/5 | $103.58 / $107.87 | EIA draw / OPEC+ / Hormuz | Ceasefire / OPEC surge |
| SI | SIN26 | Bear (ST bounce watch) | 1–3d | 2/5 | $80–81 (ST) / $70 (MT) | China IP data / FOMC minutes | China demand beat / pivot |
| HG | HGN26 | Neutral / Watch | 3–5d | 2/5 | $6.00–6.10 (bear) / $6.60 (bull) | China IP / tariff decision | China demand beat / tariff clarity |
Portfolio macro thesis: This week’s four featured setups are united by a single overarching regime: the Warsh-inflation-energy nexus. The ZN short and CL long are the two highest-conviction expressions of this thesis — both benefit when energy-driven inflation persists, and the Fed cannot cut.
They are the same trade viewed through different instruments. SI and HG are secondary expressions where the thesis is muddier: silver was the week’s biggest casualty precisely because it sits at the intersection of monetary (bearish under Warsh) and industrial (neutral to bullish if China rebounds) forces, creating extreme regime sensitivity. Copper is similarly caught between bullish structural demand and tariff-distortion mean reversion.
Sidelined markets
| Market | Wk Chg | Reason Sidelined | Watch Trigger |
| ZS (Soybeans) | −2.30% | RVOL 0.52x (below-average participation); Signal: Bullish but conflicting; no independent catalyst beyond broader ag weakness; China demand uncertainty; planting season narrative not yet active; low news intensity. | China soy buy-program or crop stress weather event (Corn Belt dryness) |
| GC (Gold) | −3.81% | Correcting from $4,800+ highs on rising real yields; Warsh-era hawkishness removes the rate-cut narrative that drove the prior gold bull. No new catalyst to reignite the safe-haven bid at current yield levels. Prefer watching ZN for the rates trade. | Iran war re-escalation or equity market crash (>5% in single session) for safe-haven bid |
| ZW (Wheat) | +4.68% | RVOL 0.46x; +4.68% gain is headline-positive but lacks volume confirmation — no trigger-bar session. Black Sea headline risk the likely driver; not confirmed by CBOT technicals or COT positioning. Signal: Weakest (bearish). | Confirmed Black Sea export disruption or Southern Plains (HRW) crop stress |
| ES (Equities) | +0.55% | Limited weekly gain on low RVOL 0.44x; equity market digesting the Warsh-rate shock and inflation data. No clear breakout catalyst present. Range-bound until the Fed tone clarifies under new chair. | China tariff deal or Warsh dovish statement for bull re-entry; VIX expansion for short side |
Week 20: Ceasefire on Thin Ice, Iran Talks, Record Earnings, and FOMC Dissent
Data as of market 10:00 am CT May 8, 2026. All prices are closing levels unless noted.
- CL collapsed 5.5% as OPEC+ fracture and Iran peace MOU progress deflated the war premium — tactical mean-reversion setups emerging from the highest-volatility week of 2026.
- ESM26 closed at all-time highs driven by an 84% Q1 EPS beat rate at 20.7% above consensus — strongest earnings season in a decade, powering blue-sky extension toward 7,500+.
- Bitcoin reclaimed its six-month bull market support band as spot ETF inflows hit $467M in a single session; CME open interest +46% YoY with 24/7 trading launching May 29.
- FOMC four-dissent hold (most since 1992) shifted policy risk skew dovish — ZN yields fell to 4.32%, a two-week low, as energy-driven inflation risk premia compressed.
- NFP +115K crushed the 62K forecast with UE steady at 4.3%; Trump-Xi Beijing summit (May 14–15) is the next binary risk event for equities, commodities, and agriculture.
Week in review: Macro context
The week of May 4–8, 2026 delivered one of the most catalyst-dense five-day stretches of the year, with four distinct macro forces intersecting across futures markets simultaneously. The dominant theme was Iran war trajectory: a fragile ceasefire declared on April 7 was visibly fraying as U.S. and Iranian forces exchanged fire in the Strait of Hormuz on May 8, yet a 14-point memorandum of understanding (MOU) was simultaneously being drafted by Trump envoys and Iranian officials. The resulting price discovery was violent — WTI crude swung from $101+ early in the week to $95.46 on May 8 settlement, a 5.5% weekly decline driven by OPEC+ output hike announcements, the UAE’s abrupt exit from the cartel (effective May 1), and advancing peace negotiations that are systematically deflating the war premium.
Against this geopolitical backdrop, equity markets decoupled from anxiety and posted new all-time highs. The S&P 500 closed above 7,365 on May 5, and ESM26 touched 7,420 on May 8, fueled by the strongest Q1 earnings season in a decade: 84% of S&P 500 companies beat EPS estimates by an average of 20.7% — both figures well above 5- and 10-year averages. Technology and health care led upside surprises, with AI infrastructure spending again driving the largest beats.
The Federal Reserve complicated the macro picture at its April 28–29 FOMC meeting. The decision to hold at 3.50–3.75% was expected, but the four dissents were not: the most in a single meeting since late 1992. Governor Miran voted FOR a 25bp cut; three others (Hammack, Kashkari, Logan) opposed, including an easing bias in the statement.
April Nonfarm Payrolls, released May 8 beat expectations decisively: +115K vs 62K forecast (prior month upwardly revised to 185K), with the unemployment rate holding at 4.3%.
The Trump-Xi summit in Beijing (May 14–15) is the next binary catalyst: a tariff agreement could be the single most equity-positive event of 2026, while failure would reintroduce trade-war risk across multiple asset classes.
Market snapshot
Data as of market 10:00 am CT May 8, 2026. All prices are closing levels unless noted.
| Market | Last | Wk Chg | Wk % | Signal |
| CLM26 | $95.46 | −$5.54 | −5.5% | Mean Reversion — war premium deflates on OPEC+ fracture + Iran MOU |
| ESM26 | 7,384 | +215 | +3.0% | Breakout Long — all-time highs, blue sky, earnings-driven |
| BTK26 | $80,455 | +$3,200 | +4.1% | Compression-to-Expansion — bull support reclaimed, ETF inflows |
| ZNM26 | 110’31 | +0’20 | +0.6% | Trend Long — yields 2-week low, FOMC dovish drift |
| ZCK26 | 460.00 | −11.25 | −2.4% | Sidelined — weekly loss, no breakout catalyst |
Crude oil (CL) - War premium in retreat
Crude oil futures (CL) delivered the week’s defining volatility narrative — a geopolitically driven collapse from $101+ to $95.46 that is carving out mean-reversion setups as the Iran war premium systematically deflates amid advancing peace negotiations and OPEC+ supply normalization.
| Root | Active contract | Branch | Regime | Setup type |
| CL | CLM26 (Jun 2026) | Energy | front_month | Mean Reversion / Event-Driven |
Price Action & Technical Structure
WTI crude opened the week above $101 and reached an intraweek high near $102 on Monday before a cascade of bearish catalysts compressed price to $95.46 by Friday’s close — a range of approximately $6.50 in five sessions (ATR expansion well above the 20-day average). The critical session was Wednesday, May 6, when oil plunged nearly 7% on reports of an imminent U.S.-Iran framework agreement, with WTI printing an intraday low near $92 before recovering to $95.08 settlement. The Friday, May 8 session produced a reversal bounce (+0.88%) as the ceasefire exchange-of-fire headlines re-ignited war-premium buying, settling at $95.46.
VWAP alignment has shifted bearish across daily and weekly timeframes, with price firmly below the weekly VWAP anchored near $99. The HTF breakdown from the multi-week $99–$105 range (confirmed on trigger-bar volume >2x average on May 6) represents a classic compression-to-expansion breakdown. Key structural levels: resistance at $99–$101 (former range floor, now capped); support at the $92–$93 intraweek panic low cluster. ATR-based mean-reversion targets from the $92 low: 1.5R = $97.50, 2R = $101. Higher-low structure is not yet established; bulls need a close above $97.50 on above-average volume.
Volume pattern confirms directional bias: the May 6 breakdown registered >2x average daily volume (trigger-bar confirmation), while the May 8 bounce showed below-average volume — consistent with a corrective, not impulse, move higher. The asymmetric trade is tactical: long on dips to $92–$93, defined risk, not chasing the bounce.
Fundamental thesis
U.S. crude inventories stood at 461.6 million barrels (May 1 EIA report), approximately 0.1% above the five-year seasonal average — not a bullish inventory read given the scale of global disruptions. The peace MOU being negotiated would gradually reopen the Strait of Hormuz and lift sanctions over 30 days — a scenario that is partially, but not fully, priced.
Scenario framing: a ceasefire deal signed within 2 weeks = WTI retests $80–$85; ceasefire breakdown/war escalation = WTI retests $105–$112. The $95 level implies roughly 35–40% probability of near-term resolution.
COT & positioning
CFTC COT data released May 1 (through April 28) showed managed money net long positions at 191.9K contracts — down significantly from 250K+ peak war-premium levels. The decline in spec longs is consistent with the price move: large traders are exiting war-premium longs rather than initiating fresh directional bets. At the 55th percentile of the prior 3-year range, positioning is not extreme in either direction, leaving room for further unwinding if the MOU advances. Note: COT data is 10 days stale and is relative to the week’s most significant moves; actual spec positioning as of May 8 is likely materially more net short than released data indicates.
Seasonals (10-year)
The 10-year seasonal pattern for CL in May is mildly bullish: WTI has averaged +2.1% gain from May 1–31 over the prior decade, with a 60% win rate (6/10 years). The typical driver is the summer driving demand ramp and the refinery's transition from maintenance to peak-season operations. However, the 2026 geopolitical overlay overwhelms the seasonal signal: war-premium pricing has already front-loaded summer demand. Current year alignment: divergent — seasonal pattern is secondary to geopolitical resolution trajectory.
Notable block trades & options
Options flow skewed heavily toward put buying during the week as institutions hedged war-premium collapse risk. Elevated put volume was observed in the $90 and $85 strike range for July 2026, suggesting hedgers are protecting against a rapid ceasefire-driven drawdown. CL implied volatility (CVOL) spiked to the 80th percentile of its 12-month range during the May 6 collapse session before easing. Call-side activity was modest ($105–$110 calls as geopolitical insurance). Skew is negative (puts bid over calls), consistent with mean-reversion expectations. Large block sell orders (multi-thousand-lot sizes) were executed between $97 and $95 on May 6, consistent with institutional de-risking of war-premium longs.
Catalyst calendar (next 10 days)
| Date | Event | Expected impact |
| May 9–10 | Iran-U.S. MOU negotiations continue | 🔴 HIGH — deal signed = −$8 to −$12; breakdown = +$5 to +$8 |
| May 13 | EIA Weekly Petroleum Report | 🟡 MOD — inventory draw vs. build; OPEC shut-in narrative test |
| May 13 | U.S. CPI April | 🔴 HIGH — energy passthrough data; shapes next FOMC cut probability |
| May 14-15 | Trump-Xi Beijing Summit | 🔴 HIGH — tariff rollback = demand optimism; failure = risk-off |
| May 16 | OPEC+ virtual meeting | 🔴 HIGH — additional hike announcements bearish; UAE exit fallout resolution |
Watch items
- Iran MOU signed within 7 days → immediate $8–$10 drawdown; exit all longs, reassess the short side.
- UAE and Saudi Arabia announce coordinated production increase >500K b/d → thesis breaks; exit tactical long immediately.
- Ceasefire fire exchange escalates beyond limited skirmish → war premium re-inflates; consider long only if price closes above $99 on trigger volume.
S&P 500 E-Mini (ES) - Record territory on earnings and Iran relief
S&P 500 E-mini futures (ES) extended one of the most powerful earnings-driven breakouts in years, with ESM26 closing at all-time highs near 7,384 as an 84% Q1 EPS beat rate powered a blue-sky extension that shrugged off geopolitical cross-currents, tariff noise, and FOMC uncertainty.
Contract metadata
| Root | Active contract | Branch | Regime | Setup type |
| ES | ESM26 (Jun 2026) | Equity Indices | front_month | Trend Continuation / Breakout |
Price action & technical structure
ESM26 opened the week near 7,170 and advanced steadily to new all-time highs throughout, with the most explosive session being Wednesday, May 6 when the Dow added 612 points (+1.24%) on Iran deal hopes, and ESM26 cleared the 7,300 area on above-average volume. The close above 7,365 on May 5 marked the first settlement above that level in history; by May 8, ESM26 printed 7,420 — in blue-sky territory with no overhead supply or resistance visible on any major timeframe. Weekly gain of approximately +3.0% on consistent volume participation across all three sessions (Asia, Europe, and the U.S. all contributing).
VWAP alignment is firmly bullish: ESM26 has traded above both the weekly and daily VWAP continuously since the April 30 session. The HTF structure shows a confirmed compression-to-expansion sequence: three weeks of range-bound action between 6,950–7,100 broke to the upside on April 30–May 1 on trigger-bar volume (>2x average), and the subsequent expansion has not seen a meaningful pullback. Higher-low structure is intact — recent reaction lows at 7,200 (May 4 morning) held on intraday tests. ATR-based targets from the 7,100 breakout level: 1.5R = 7,450, 2R = 7,600.
The tariff overlay adds option value in both directions: EU car/truck tariffs at 25% (announced this week) and a 50.5% Polymarket probability of “no US-China tariff agreement by May 31” are headwinds.
However, the Trump-Xi summit (May 14–15) could rapidly flip both; a tariff resolution would be an incremental upside catalyst. The risk is a summit failure, which would be an air-pocket event for ES and potentially test 7,200 support.
Notable block trades & options
Options activity in SPX leaned bullish over the past week, with call-buying in the 7,400–7,500 strike range dominant. VIX declined from 18–19 to approximately 15–16 on the week, a compression reflecting declining realized volatility and growing trend conviction. The CBOE equity put/call ratio fell to 0.65 (bullish skew) by Friday. Large block-buy programs were visible on ESM26 during the Wednesday surge, with sweep orders printed on the ask side. Notable institutional positioning: call spread structures in the 7,300–7,500 range, targeting the 7,400–7,500 zone within the hold window.
Catalyst calendar (next 10 days)
| Date | Event | Expected impact |
| May 13 | U.S. CPI April | 🔴 HIGH — core <0.3% MoM bullish for rates and ES; >0.4% bearish |
| May 14-15 | Trump-Xi Beijing Summit | 🔴 HIGH — tariff rollback = significant upside catalyst for ES |
| May 15 | Retail Sales April | 🟡 MOD — consumer demand confirmation for services-led growth |
| May 15 | PPI April | 🟡 MOD — pipeline inflation context for CPI trajectory |
| May 16-17 | First Warsh Fed remarks (if confirmed) | 🔴 HIGH — tone-setting for June FOMC; hawkish = VIX spike |
Setup summary
| Direction | Hold period | Key levels | ATR target | Conviction | Risk flag |
| Long | 2–5 days | Support 7,200 / Resistance None (blue sky) | 1.5R: 7,450 / 2R: 7,600 | 4/5 | Summit failure / Warsh hawkish |
Watch items
- Trump-Xi summit produces no agreement or tariff re-escalation → ES loses 7,200 support; thesis weakens materially; reduce exposure.
- April CPI core >0.35% MoM → Fed cut probability shrinks; real yield re-expansion pressures tech multiples; watch VIX expansion above 20 as a warning flag.
- Kevin Warsh makes hawkish pre-FOMC statement → rate volatility spikes; VIX >20 is the threshold to reduce ES exposure.
Bitcoin CME futures (BTC) - Bull support reclaimed, institutions return
Bitcoin CME futures (BTC) posted a decisive reclaim of the six-month bull market support band, with BTK26 trading at $80,455 as institutional ETF inflows hit a single-day record of $467M — a compression-to-expansion breakout supported by the most credible structural upgrade of the 2026 cycle.
Contract metadata
| Root | Active contract | Branch | Regime | Setup type |
| BTC | BTK26 (May 2026) | Crypto (CME) | front_month | Compression-to-Expansion / Breakout |
Price action & technical structure
BTK26 opened the week near $77,000–$78,000 and advanced steadily to $80,455 by May 8, reclaiming both the $79,000 prior resistance level and the bull market support band (a moving average envelope that has preceded every major BTC rally since 2019). The May 5 close above $80,000 was the confirming trigger bar: CME volume ran >1.8x the 20-day average, with the daily range expanding as price broke above the resistance zone that had capped multiple prior attempts since early February. The reclaim of this band — first time in six months — carries historically strong predictive value in prior cycles.
VWAP alignment has turned bullish on both daily and weekly timeframes, with price reclaiming the weekly VWAP near $78,500 and holding above it for four consecutive sessions. The HTF structure shows a textbook higher-low sequence: lows at $60,500 (Feb), $66,000 (Mar), $74,000 (Apr), and the current base above $79,000. Blue-sky structure prevails from $80K upward on shorter timeframes, with no major overhead supply until the $92K–$95K zone (prior distribution range). ATR-based targets from the $77K base: 1.5R = $87,500–$90,000, 2R = $97,000–$100,000.
Fundamental thesis
The fundamental case is primarily driven by institutional infrastructure. Spot Bitcoin ETFs saw $467M in single-day inflows led by BlackRock and Fidelity, extending an accumulation streak that has driven approximately 270,000 BTC purchased by institutional buyers in the prior month alone. Exchange reserves are near multi-year lows as supply migrates from exchanges to ETF custody, creating a structural supply-demand imbalance. Post-2024 halving issuance, combined with institutional demand absorption, creates a structural floor effect that distinguishes this cycle from 2021–2022.
Two CME-specific catalysts are structurally significant for futures traders: (1) CME launches 24/7 Bitcoin futures trading on May 29, eliminating the Friday 4 PM–Sunday 5 PM CT gap that has historically created gap risk in the BTC futures basis; and (2) CME is planning Bitcoin Volatility futures (BVOL) for June 1 launch (pending regulatory review), opening new institutional hedging channels and deepening the futures ecosystem. CME average daily volume in crypto is up 46% YoY to 407,200 contracts in 2026 — institutional participation is at a cycle high.
Seasonal (10-year)
Bitcoin seasonal patterns have limited statistical significance vs commodity markets (shorter history, evolving structure), but the post-halving year pattern is highly relevant: in prior post-halving years (2020, 2024 cycles), the average May–June return was +32% with a 100% win rate (sample: 3 observations). 2026 is the first May post-2024 halving, making it the directly applicable reference. Current year alignment: strongly aligned with post-halving seasonal bullish tendency. Interpret with appropriate sample-size caution.
Notable block trades & options
CME Bitcoin options showed substantial call buying in the $85K–$95K strike range during the week, particularly in June and July expiry. Implied volatility (BTC BVOL proxy) declined from the 65th to the 45th percentile of its 12-month range, reflecting a rally occurring on falling fear — a structurally healthy signal versus fear-driven spikes. The put/call ratio on CME BTC options fell to 0.58 (bullish skew). Notable prints: multi-hundred-contract call sweeps at the $85K and $90K strikes on May 5–6, consistent with institutional targeting of the prior all-time high zone.
Catalyst calendar (next 10 days)
| Date | Event | Expected impact |
| May 9-10 | Continued ETF inflow data | 🟡 MOD — streak >5 sessions = sentiment confirmation; break = watch $77K |
| May 13 | U.S. CPI April | 🟡 MOD — soft = risk-on; BTC correlates with risk assets at this macro juncture |
| May 14-15 | Trump-Xi Beijing Summit | 🟡 MOD — tariff relief = broad risk-on, supportive for BTC |
| May 16 | CME monthly BTC options expiry | 🟡 MOD — max pain and pinning dynamics near $80K |
| May 29 | CME 24/7 BTC futures trading launches | 🟢 LOW (structural) — reduces gap risk; long-term positive for liquidity depth |
Setup summary
| Direction | Hold period | Key levels | ATR target | Conviction | Risk flag |
| Long | 3–7 days | Support $77K–$78K / Resistance $92K–$95K | 1.5R: $88K–$90K / 2R: $97K–$100K | 4/5 | Risk-off shock / ETF outflows |
Watch items
- ETF inflow streak breaks (net outflows >$200M in a single session) → demand thesis weakens; watch for price break of $77K support.
- Iran war escalates materially (carrier group engagement, Strait fully closed again) → global risk-off event; BTC correlates with equities in >5% down sessions.
- Regulatory setback (SEC action, Congressional crypto legislation fails) → institutional participation thesis challenged; reassess position sizing.
10-year Treasury Note (ZN) - Four dissents and a falling yield
10-Year T-Note futures (ZN) emerged as the week’s most policy-driven setup: ZNM26 gained as 10-year yields fell to 4.32% (a two-week low) as the FOMC’s four-dissent hold signaled a Fed inching toward its first cut, while lower oil prices compressed energy-driven inflation risk premia in the long end.
Contract metadata
| Root | Active contract | Branch | Regime | Setup type |
| ZN | ZNM26 (Jun 2026) | Interest Rates | benchmark_quarter | Trend Continuation |
Price action & technical structure
ZNM26 opened the week near 110-11 (110.34) and rose to 110-31 (110.97) by Thursday, May 7, as yields declined for three consecutive sessions. The yield moved from approximately 4.45% to 4.32% over the week, representing roughly 13 basis points of rally, or approximately 30/32 in price terms — a meaningful move for a rates instrument. Volume was solid on the rally days (Tuesday and Thursday), consistent with institutional repositioning following the FOMC dissent's revelation.
Technical structure is constructive: ZNM26 has established a series of higher lows since the April 29 post-FOMC close (110-00 was the post-FOMC anchor), and the week’s price action extends that trend cleanly. VWAP alignment is bullish on the daily timeframe with ZNM26 trading above the 5-day VWAP near 110-22. Key resistance: 111-00 to 111-16 (the area that capped the last significant rate rally in late March). Support at 110-00 (round level + former FOMC settle) serves as the thesis invalidation zone. ATR-based targets from the 110-00 base: 1.5R = 111-00 to 111-11; 2R = 111-16 to 111-22.
Fundamental thesis
The ZN bull case rests on three converging pillars: (1) the FOMC’s four-dissent structure signals asymmetric policy risk skewed toward cuts — Governor Miran’s explicit vote for a 25bp cut is the first formal easing dissent since the hiking cycle ended, a significant regime signal; (2) Iran peace progress is reducing energy-driven inflation risk premia in long-dated Treasuries — if WTI normalizes toward $80–$85, headline CPI projections for Q3–Q4 2026 fall materially; and (3) April NFP (+115K) confirmed labor market cooling, incrementally supporting the case for the Fed delivering its projected 2026 cut (dot-plot median: year-end FFR 3.40%).
The primary risk to the thesis is the succession of Kevin Warsh. Trump’s nominee is expected to take over as Fed chair at or before the June 16–17 FOMC. Warsh is historically more inflation-hawkish than Powell; his arrival could reset policy communication unfavorably for Treasury longs. The May 13 CPI print is the near-term gating factor: benign (<0.3% core MoM) = ZN rally accelerates; hot (>0.35%) = thesis challenged.
Notable block trades & options
Interest rate options activity increased post-FOMC meaningfully. The four-dissent hold triggered a surge in ZN call buying, particularly in the 111-00 and 112-00 strike range for June expiry — positioning for continued yield compression. Put/call ratio for ZN options shifted from 1.20 (net puts) to 0.85 (near neutral) over the week, reflecting the sentiment shift. CME 10-Year Note CVOL declined from the 70th to 58th percentile of its 12-month range, signaling volatility normalization after the FOMC event. Multi-thousand-contract buy programs were executed at key technical levels on Tuesday and Thursday, consistent with institutional reallocation.
Catalyst calendar (next 10 days)
| Date | Event | Expected impact |
| May 12 | 3-Year Treasury Auction | 🟢 LOW — front-end demand gauge; indirect ZN signal |
| May 13 | 10-Year Treasury Auction | 🔴 HIGH — direct ZN demand test; tail vs. WI is the key metric |
| May 13 | U.S. CPI April | 🔴 HIGH — single most important near-term data catalyst for ZN |
| May 14-15 | Trump-Xi Summit | 🟡 MOD — tariff relief = mild ZN negative (risk-on); failure = ZN positive (flight-to-quality) |
| May 15 | 30-Year Treasury Auction | 🟡 MOD — term premium signal; weak long bond = ZN pressure at the margin |
Cross-market overview
| Symbol | Active | Direction | Hold | Conv. | ATR target | Key catalyst | Risk |
| CL | CLM26 | Tactical Long | 1–3d | 3/5 | $97.50–$101 | Iran MOU progress/collapse | OPEC+ surge/war escalation |
| ES | ESM26 | Long | 2–5d | 4/5 | 7,450–7,600 | Trump-Xi summit / CPI | Summit failure / Warsh hawkish |
| BTC | BTK26 | Long | 3–7d | 4/5 | $88K–$100K | ETF inflows / CME 24/7 | Risk-off shock/outflows |
| ZN | ZNM26 | Long | 3–7d | 3/5 | 111-00 to 111-16 | CPI April / FOMC drift | Hot CPI / Warsh pivot |
Portfolio macro thesis: The four featured setups share a common scenario dependency — all four benefit from the same geopolitical and monetary resolution: an Iran peace deal reduces oil prices, eases inflation expectations, supports FOMC dovish drift, and sustains the risk-on environment, enabling the earnings-driven equity and crypto bull market to extend. This is a scenario-concentrated portfolio: CL (mean-reversion long), ES (trend long), BTC (breakout long), and ZN (rates long) all have their maximum drawdown in the same scenario — ceasefire collapse plus hot CPI. Traders should monitor these as a correlated portfolio, not four independent trades.
Correlation risk assessment: CL and ZN are inversely correlated in the Iran war regime (higher oil = higher yields = ZN bearish). Holding both as longs creates a natural hedge if Iran sentiment bifurcates. ES and BTC share high beta in risk-on phases and will draw down together on war escalation or CPI shock. Concentration warning: ES, BTC, and ZN all benefit from the same dovish inflation outcome. A single hot CPI print on May 13 adversely impacts all three simultaneously. Consider reducing to 2 of 3 before May 13 if overall portfolio risk tolerance is limited.